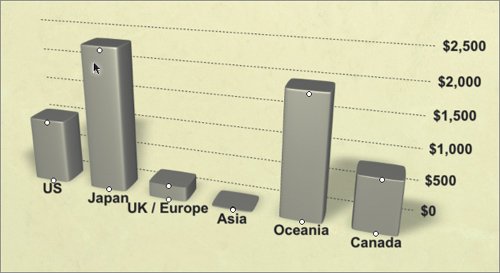
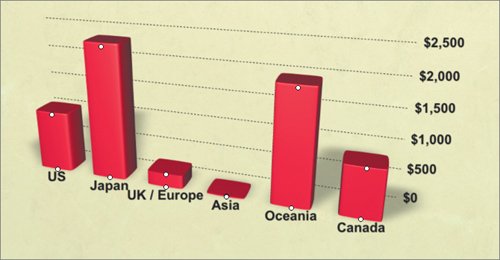
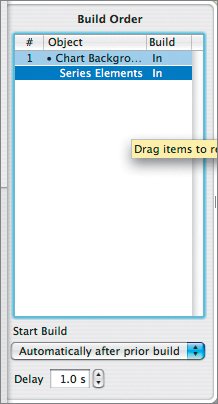
Animating a Bar Chart


You can set up a bar chart to grow over time. You also can use 3D perspective to improve your chart's readability for the audience.

1.

Select slide 4 in the slide organizer.

2.

Select the chart in the canvas. Then select the Chart Inspector.

3.

From the Chart Type menu, choose the first 3D option.

The chart is rendered in 3D, but it is using a flat gray color, which you will change.

4.

Click one of the vertical bars.

All of the bars become selected.

5.

Select the Graphic Inspector; then click the Fill color well to open the Colors window.

6.

With the magnifying glass, select the red in the logo to color the chart.

7.

Select the Build Inspector and click Build In. Then choose the following options:

  • Effect: Dissolve

  • Delivery: By Element in Series

  • Duration: 1.00 s

  • Choose 2 from the Build from menu; leave the Build to menu set to Last.

8.

Click the More Options button.

9.

In the Build Order list, select Series Elements.

10.

For Start Build, choose Automatically after prior build; for Delay, choose 1.0 s.

11.

Select the Slide Inspector and click Transition. Then choose the following options:

  • Transition Effect: 3D Effects: Page Flip

  • Direction: Up

  • Duration: 2.00 s

12.

Press Command-S to save your document.


Apple Training Series. iWork '06 with iLife '06
Apple Training Series: iWork 06 with iLife 06
ISBN: 0321442253
EAN: 2147483647
Year: 2004
Pages: 171

flylib.com © 2008-2017.
If you may any questions please contact us: flylib@qtcs.net