Visualizing the Debug Trace
|
| < Free Open Study > |
|
We placed the output from all three techniques within tags. This allows the results to be easily interpreted by other applications. By preceding the logged results with an appropriate XML DTD we could use the Java API for XML Processing (JAXP) as a basis for additional programs that analyze the results (for example by counting up the number of calls to each method) or that present the results in a more readable form.
I've created a trace viewer that takes the file produced by the JPDA Debugger, or an equivalent file that you create by picking out blocks of DebugListener and EventListener entries from the Tomcat server log file.
The source code for this class won't teach you about debugging, so we won't show it here. It is however, included in the code download available from http://www.apress.com/.
To use the TraceViewer you'll need a file that contains tagged output from the JPDA Debugger, or built from entries taken from the server log file. If the output is in a file called debug.txt, you can view it by running this command:
java debugging.TraceViewer debug.txt
Sample Debug Trace Visualizations
We'll look at two sample visualizations of the debugging output. We'll do this not only to illustrate how the output may be presented in a more aesthetically pleasing way but also to highlight one of the subtleties of our debugging code.
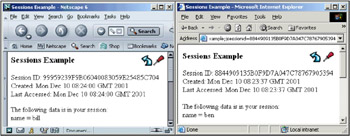
We'll run the SessionExample servlet simultaneously in two browser windows, to demonstrate a multi-user scenario. In one window we set the attribute name to value bill and in the other window we set it to value ben:
In this sample visualization I've combined events from the Debugging Filter and the Debugging Listener, with both sets of events taken from the server log file:
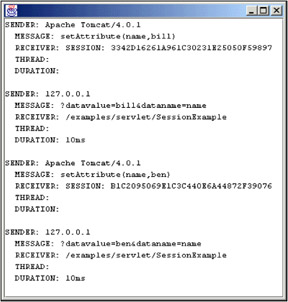
This is easier to follow than the tagged text, and it shows something very important. According to this trace, the attributes have been set before the servlets that set them have actually been invoked. The container is not psychic, and it's not broken either. The problem can be found back in the doFilter() method of the DebugFilter class, which included these lines of code:
long startTime = System.currentTimeMillis(); chain.doFilter(request, response); long endTime = System.currentTimeMillis(); long duration = endTime - startTime; messageBuffer.append("<duration>" + duration + "</duration>"); messageBuffer.append("</invocation>"); filterConfig.getServletContext().log(messageBuffer.toString()); In order to record the duration of each servlet invocation, we didn't add the invocation to the server log file until it completed, during which time some attribute modifications occurred and were trapped by the event listener. So to see messages in the correct order we would need to move the final line of code to precede the call to chain.doFilter(), although this would result in the loss of the duration information.
Here is the JPDA Debugger view of the same scenario:
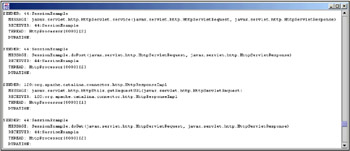
This sample visualization illustrates two very important things about the JPDA Debugger:
-
It can be used to discover the inner workings of the servlet container down to the deepest level, limited only by the class packages that are specified when it is run.
-
It can record the thread on which each event occurred (in the form of HttpProcessor[8080][1]). This shows that multiple concurrent clients (in this case two) are serviced by separate threads (more about that in the next chapter).
Both of those features are only available by using the JPDA.
|
| < Free Open Study > |
|
EAN: 2147483647
Pages: 130