Technical Solution
| We are focusing on developing the reporting piece for this solution, so we have already implemented the data model and loaded the data warehouse database (ProfessionalServicesDB) following the guidelines and best practices we presented in previous chapters (if only it was that easy in the real world!). Getting Started with Reporting ServicesWe start by using the BI Development Studio to create a new Report Project. The project will be created in a folder on your development machine and will contain a set of Report Definition Language (RDL) files, which will eventually be published to the reporting server. The BI Development Studio includes a Report Wizard to walk you through the steps for defining a report, which consist of the following:
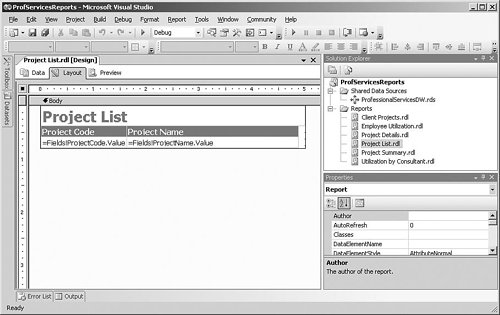
The resulting RDL report design files are based on XML and are usually edited using the graphical report designer. This designer enables you to graphically define the query and then drag-and-drop fields onto a design surface to build the report. Because you are working locally with the report files and have not yet published them to a report server, the designer also includes a Preview pane where you can run the report and view the results directly in the development studio.
The wizard creates the report project files, including the shared data source and Project List report, and opens the report in the report designer. You can adjust the design of the report on the Layout tab, modify the query on the Data tab, or use the Preview tab to see the report with data. Tip: Use Shared Data Sources Every report needs a data source that defines the database connection information, including the name of the database server and the credentials that will be used to connect. Although you can define this information separately for each report, a much better option is to use a shared data source. Doing so enables you to define the database connections to be used for the entire project, which will be referenced by the individual reports. The advantage of this approach is that you can change the connection information for all the reports in a single location, which proves useful, for example, when you move from development to production servers. Adding Calculations to ReportsMany reports need some form of calculation logic, such as subtotals or percentages. You have two choices about where to perform these calculations: either as part of the SQL query or stored procedure that provides the source data for the report or using Reporting Services expressions. Expressions are based on VB.NET syntax, so some knowledge of this language is always helpful, but not mandatory. One of the most common uses for expressions in reports is to add information such as page numbers or execution time to reports. To add a page number to the bottom of report, turn on the page footer by selecting Page Footer from the Report menu, and drag and drop a text box control from the toolbox into the section. Right-click the text box and choose Expression to show the expression editor. In addition to being able to display the current values of fields or parameters, some global variables are available, including the page number and total pages in the report. If you select PageNumber from the Globals section in the expression editor, you will see that it adds the expression =Globals!PageNumber. You could also use string concatenation and multiple variables in an expression. For example, to display "Page 3 of 10" at the bottom of the report, use the following expression: ="Page " + Globals!PageNumber.ToString() + " of " + Globals!TotalPages.ToString() Notice that because we are concatenating strings and numbers, we had to convert the page numbers to strings using the ToString() syntax. Deploying Reports to the ServerWhen you have finished developing the report in this section, you can publish the project by selecting Deploy Solution from the Build menu. The report will be available to users when we have configured the security in a later section. When you deploy a solution from Visual Studio, the reports and data sources are published to the server that you initially specified in the Report Project Wizard. You can change this server using the project properties dialog (select Properties from the Project menu), which allows you to specify the URL for your report server and also the name of the folder to publish the files into. Because you may be deploying to a server that has different source databases than your development environment, you can also choose not to overwrite any data sources that have already been set up on the server by making sure the OverwriteDataSources setting is false. Accessing ReportsAs mentioned in the "High-Level Architecture" section, end users will be using the Report Manager Web-based tool to access reports. Now that we have published the reports, it would be a good idea to get familiar with this tool. To use Report Manager, open a Web browser and navigate to http://MyServer/Reports, where MyServer is the name of your report server. Reports on the server are grouped into folders, such as a ProfServicesReports folder for the project that you just deployed. Click this folder to view the list of reports and data sources. To run a report, click the link and it will be executed and displayed in the browser, as shown in Figure 6-7. Figure 6-7. Viewing a report in Report Manager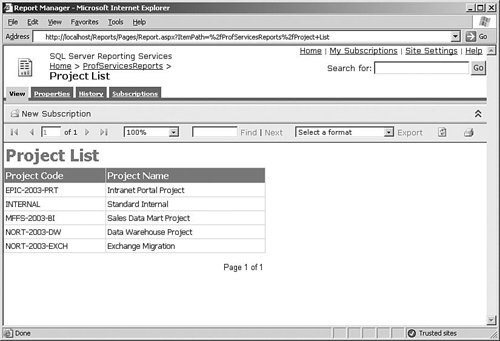 The report displays in HTML format initially, but users can select another format and click Export to view the report in Excel, Acrobat (PDF), CSV (comma-delimited), or even XML. Users can also print the report using the Print button on the toolbar, which uses an ActiveX control downloaded to the computer when the user first selects this option. All printing happens on the client machine itself because there is no facility to print directly from the server.
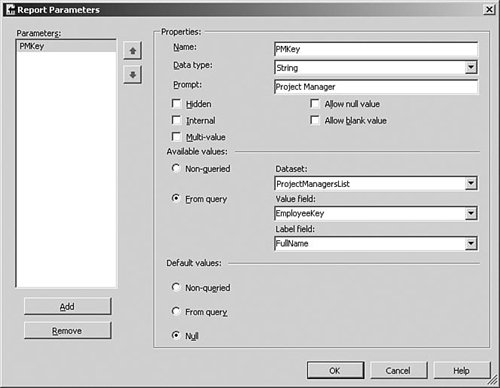
Giving Users What They WantNow that we have completed a simple report and seen how the user will ultimately access the reports, we can move on to developing some of the more complex reports for the solution. The report that we have looked at so far has just presented a list of information to the user, but most reports are usually targeted to the individual user's needs. The most common approach to handling this is to add parameters to the report. When users run the report, they are prompted to specify some values for the parameters, which are then used to limit the data that is displayed.
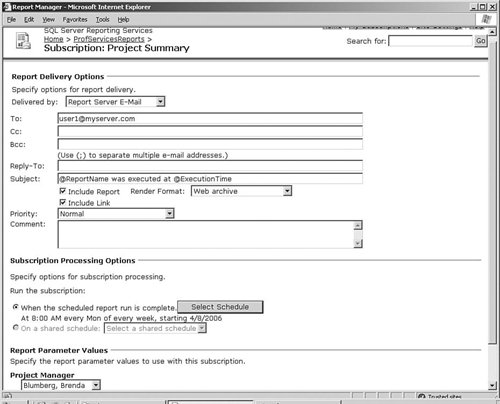
Using the User's IdentityAnother approach to tailoring report content is to use the user's network ID to retrieve data specific to the user. For example, the Project Summary report could retrieve the network ID of the user who is running the report using the User!UserID expression as the default value of a parameter, and then display the relevant information. For this to work correctly, you need to have a column in the Employee table that maps an employee's record in the database to the employee's network ID, such as MYDOMAIN/JSMITH, where MYDOMAIN is the name of your domain. Presenting InformationWith the huge amount of information available in most companies today, most reporting solutions need to include ways of summarizing information and allowing the user to learn more information as required. The reports in our Professional Services solution achieve this by presenting summarized information and using other report formats or providing drilldown to show more detailed information. Adding Groups and SubtotalsOne of the most common ways of presenting summary information is to add groups and subtotals to a report, as shown in Figure 6-9. Detailed report data can be grouped by fields in the report, such as client name or month, or by more complex expressions that you define. For calculating subtotals, Reporting Services expressions can include functions such as Sum, Avg, Min, or Max, which can be used with numeric fields and added to the grouped row. You can also include more complex calculations such as running totals or row numbers using the RunningValue and RowNumber functions. Figure 6-9. Groups and subtotals For example, because our solution includes some clients with many projects, we will design a Client Projects report that shows a list of projects by client, along with a subtotal of the current project budgets. The report expression to calculate the sum of projects for a client would be =Sum(Fields!TotalBudget.Value). Groups are really easy to achieve in Reporting Services: If you are using the wizard to create a report, you can specify that the Client Name field is a separate Group rather than in the Details with everything else. If you miss this step in the Report Wizard, you can create a group within a table by selecting the Detail row in a report table, right-clicking and choosing Insert Group. You can then drop the columns that you want into the new group headerthe designer is smart enough to specify a sum expression if you drop numeric fields such as the project budget into a Group section. Using Different Types of ReportsThe reports that we have looked at so far have all been based on table layouts, each with a fixed set of columns. Many of the reports in our solution are time based and show performance over time, so it would be useful to be able to show one or more columns for each month in a report. Reporting Services supports this kind of reporting using a report item called a Matrix, which can include column groups as well as just row groups. We can use a Matrix report to build the Employee Utilization report that shows utilization percentages over the months of a fiscal year, as shown in Figure 6-10. Managers can use this to track the performance of the consultants that report to them. Matrix reports can be created either by selecting the Matrix report type in the Report Wizard or by opening a report and dragging a Matrix on to the report, and then dropping appropriate fields into the Rows, Columns, and Data areas. Figure 6-10. Matrix report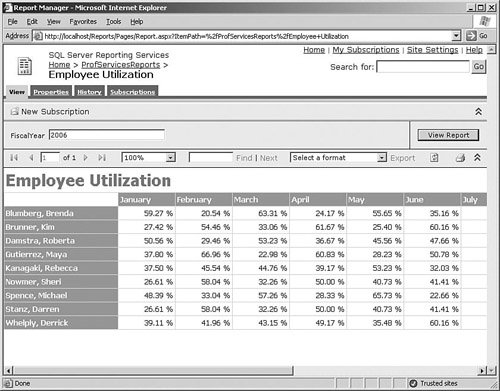 Reports also often need to include information that is not arranged in either tables or matrices. The List report item is used for reports that have flexible layouts, such as order reports that have a free-format header section containing customer information, then a table containing all the order details. The Project Details report is an example of this kind of report; the project information fields such as name, start date, and total budget are at the top of the page along with captions, and there are also two matrices containing work completed by employee and task, as shown in Figure 6-11. To create this type of report, drop a List item onto the report, and then drop fields and text boxes in the List area. Figure 6-11. List report designer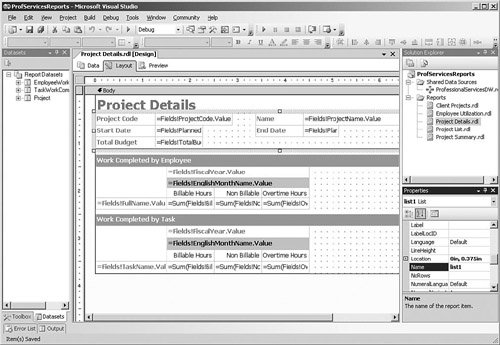 Finally, reports can also include Chart report items, which support a wide range of common chart types such as pie, bar, and line. The chart also supports multiple series, so you can build some fairly sophisticated charts. Drilling Down to See More DetailsTo avoid swamping users with long, multi-page reports, we can also design reports so that they present a short summary of the information to the user when they initially view the report, and then they can click links in the report to drill down to see more information. The Client Projects grouped report that we built previously would end up displaying a large amount of information. So instead of just showing a list of projects with subtotals, we could initially just show a list of clients along with a total of their current project budgets, and then allow the user to click the client name to see the breakout of individual projects, as shown in Figure 6-12. Figure 6-12. Drill down to show details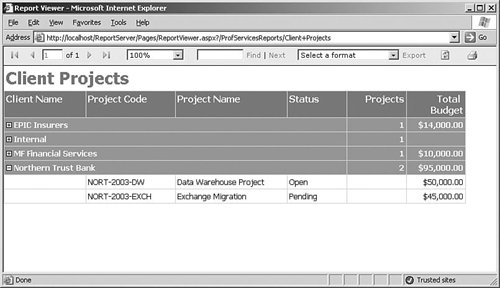 To implement this, first we need to define a group on Client Name, which will be the summary level for our report. To specify that the details of each client's projects are hidden at first and then displayed when the user clicks a client name, select the Details row in the table and then look in the Properties window for the Visibility section. Specify a Hidden value of True to hide the details section initially, and then for ToggleItem, select the field that you want the user to click (in this case, the Client Name field). This idea is applied all over the place in Reporting Services and is a powerful way to show the user what they want. Drilling through to Detailed ReportsAnother approach to dealing with presenting large amounts of information is to show the user a summary report that contains hyperlinks that launch a separate report with the detailed informationthis approach is known as drillthrough. For example, project managers who are using the Project Summary report that we built earlier will need to be able to run a Project Details report that prompts for a specific project and shows detailed information such as the hours that consultants have billed to the project, remaining budget, and tasks completed, as shown in Figure 6-13. Figure 6-13. Drill through to detailed reports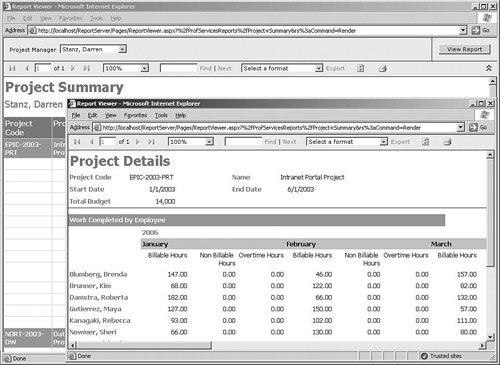 To set up the hyperlink, open the Project Summary report that we built in the previous Quick Start and right-click the Project Code field to open the Properties dialog, and go to the Navigation tab. If you select the Jump to Report radio button, you will be able to select the Project Details report and also specify that the Project Key field value should be used for the ProjectKey parameter for this report. Securing the InformationThe users of the professional services reporting solution can be categorized into three groupsconsultants, project managers, and business operations staff. Each of these groups needs different information, and we would like to prevent some users from seeing certain information. For example, consultants should be able to see their own utilization and billing performance, but not the performance of their colleagues. Managers, on the other hand, should be able to see the utilization of all consultants that report to them. Restricting access to information is a common requirement in most reporting solutions, and Reporting Services has a flexible model to support it. In addition to controlling who can access a report, Reporting Services also allows administrators to control who can perform tasks such as uploading new reports. Permissions can be granted at a folder level rather than just individual reports, for example, so that you can allow users in a specified Windows group to access all reports in a folder. For our solution, we start by creating three Windows groups and adding the Windows accounts of the users to the appropriate groups. Most users can see all the reports, so with Report Manager, we will open the Properties for the report folder and add all three groups with the Browser role. This will set the default security for all reports in the folder, and then we can override the security settings for specific reports, such as removing the Consultants group from the Business Operations reports. Using Linked Reports to Present Limited ViewsOne specific requirement for our solution is that consultants can only see their own utilization report. We could just build two separate reports, one report that only managers could see that contains a parameter to allow any consultant to be selected, and another report that uses the User!UserID expression to only display the user's own utilization. However, Reporting Services includes a feature called Linked Reports that we can use for this requirement without having to build and maintain two separate reports. These have a link to an existing underlying report, but can hide parameters and supply specific parameter values, as well as have a different set of security permissions than the original report. We can start by creating a Utilization by Consultant report with a parameter that presents a list of consultants but defaults to the current user's record. In Report Manager on the Properties tab for this report, click the Create a Linked Report button. You can change the name to something like My Utilization and click OK, and the new linked report will display. You can then change the parameters for the linked report by unselecting the Prompt User check box so that the user is not prompted to select a consultant for the My Utilization linked report. Finally, secure the reports by only permitting members of the Manager role to view the Utilization by Consultant report but allowing all three groups to view the My Utilization report. Managers will then be able to choose any consultant for the report using the parameter, but everyone else will only be able to see his or her own utilization. Accessing the DatabaseNow that we have secured the reports for our solution, we can move on to the topic that generally has the most effect on performance and scalability for reporting: controlling how and when the source databases are accessed. Credentials Used to Access Database SourcesAt some point before a report can be displayed for a user, Reporting Services connects to the data source and executes the queries required for the report. When you create a new data source, Windows integrated security is used by default, which means that the credentials of the user running the report are used to access the database. However, if the source database is on a separate server, Kerberos will need to be enabled to allow the user's credentials to be passed from the reporting server to the database server. (Talk to your friendly network administrator for more information on this topic.) Unlike client/server applications, Web applications usually avoid this approach of using the user's credentials to access the database, because this means that connection pooling is ineffective and expensive database connections cannot be reused. The most common approach is to use Windows security to restrict users' permission to access the reports, as described in the previous section, and then use specific credentials to allow the reporting server to access databases. These credentials are stored securely on the reporting server (meaning they are encrypted and can only be read by the Reporting Services service) and consist of either a Windows username and password or a SQL Server username/password. We will be using a specially created Windows account for our reporting solution that has the minimum possible permissions required to access the database. You must avoid using powerful accounts such as administrator-level Windows accounts or the SQL Server sa account for this purpose. Controlling When Database Queries Are ExecutedIf users always require the most up-to-date information, report queries need to be executed every time a user views a report. This can place a huge burden on database servers and is not usually a recipe for scalability. Most reports don't require data to be quite so current, especially when those reports are built on a data warehouse that is only updated periodically. You can get a lot of performance improvement by turning on report caching using the Report Manager execution properties for the report. This caches a format-neutral combination of the data and report layout, so the same cached data can be used whether the user requests the report in HTML or any other format. The cached information can be set to expire either after a specified number of minutes or by using a schedule (for example, to expire caches every night). If a report uses parameters, a separate cache is created for every combination of parameter values that is used. One problem with the caching approach is that the first user who requests the report must wait while the data is fetched, whereas all subsequent users who request the same report and parameter values get the benefit of caching. To avoid this problem, Reporting Services enables you to control when the queries are executed using snapshots, which are executed at a specific time and cache the resulting data. These settings are also controlled using execution properties in Report Manager. This is useful in data warehouse scenarios because we can schedule the report snapshots to be created after the nightly batch processing. Multiple snapshots can also be stored so that a history is created, and the user can easily see how the report looked at some time in the past. A few caveats apply to snapshots, however. Because the report is not executed by a user, any parameters defined for the report will use the default values. Also, for both cached and snapshot reports, credentials to access the database must be stored with the data source. You can work around the default parameter issue by defining separate linked reports for every parameter combination that you want to cache, but, of course, this approach is limited to specific types of reports. Subscribing to ReportsMost users really like the idea of having some reports e-mailed to them on a regular basis, especially now that so many people manage their whole life through their inbox. Reporting Services allows users to set up their own subscriptions using Report Manager and also enables administrators to set up a data-driven subscription that sends reports to a whole list of users, with the parameters set up so that relevant information is e-mailed.
Tip: Testing Subscriptions Unless you want to wait until next Monday to see whether the subscription works the way you want it to, it helps to know something about how Reporting Services handles scheduling. A SQL Server Agent job is created for the subscription, named with a GUID that is used by Reporting Services to keep track of the job. Right-click the job in SQL Server Management Studio and choose Start Job, which will trigger the start of the subscription processing. In Report Manager, you can go to the Subscriptions tab for the report and refresh the view a few times to see how it proceeds. Sending Subscriptions to a List of UsersIn our solution, we probably don't want to make each project manager set up his own subscription, so we can use a data-driven subscription for this report. This is created using the New Data-driven Subscription button on the Subscriptions tab for the report. We have already defined an EmailAddress column in the Employees table in the data warehouse, which will come in handy now because the Data-Driven Subscription Wizard allows you to specify a query that is executed to produce a list of e-mail addresses to send the report to. Also, for the Project Manager parameter, you can use the EmployeeKey column in the same table, so that each project manager receives a tailored report. We can use the same approach to e-mail consultants their personal utilization report every month. Sending Reports to File SharesWe can also make the business operations team blissfully happy using a subscription with the File Share delivery extension. Nothing makes a financial person happier than a nice, up-to-date Excel spreadsheet that appears in his or her network folder every week. This type of subscription can be set up in the same way as the e-mail subscription above, so you can use a data-driven subscription that executes a query to determine information such as a list of network locations to write reports to. This is also commonly used for financial reports that show a current position, because you can set up the subscription to use a different filename for each file that uses the current date. Over time, this will produce an archive of files that show the changing positions. |
EAN: 2147483647
Pages: 132