Analysis Services
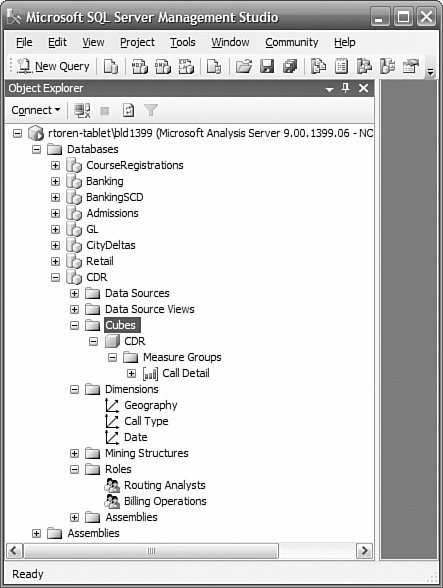
| SQL Server Analysis Services is an engine designed to support storing and querying large amounts of data based on dimensional models. Analysis Services implicitly understands concepts such as dimensions, hierarchies, slicing, and filtering. Using Analysis Services, you no longer need to worry about how to construct complex SQL statements to do the kind of analysis of your data commonly performed in BI applications. In addition to simply presenting a set of values as output, Analysis Services can assist in interpreting these values. Data mining capabilities in Analysis Services can provide insight into the relationships between different aspects of your data (for example, how level of education correlates with credit risk). Another common application in BI is key performance indicators (KPI), where you are measuring success against some pre-established goals. Analysis Services ArchitectureAnalysis Services reads data from one or more sources to populate the dimensions and cubes you have designed. It is a distinct service from the SQL Server database engine. Most common data sources can be used by Analysis Services as data sources. You can just as easily create Analysis Services databases with Oracle or Access databases as you can with SQL Server databases. Like the SQL Server database engine, Analysis Services is a server application, as shown in Figure 2-7, not an end-user application. Queries in the form of Multidimensional Expressions (MDX) statements are submitted to the server, and results are typically returned to the user through Excel, Reporting Services, Business Scorecard Manager, or third-party tools such as ProClarity, Cognos, and Panorama. Communication with end-user applications is done using XML for Analysis (XMLA), an open standard for interfacing with data sources. The XMLA council has more than 20 vendors (and many more subscribers to the standard). Figure 2-7. Analysis Services architecture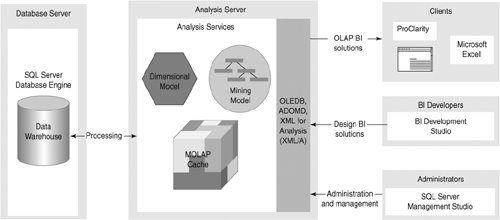 Usually a single server machine runs a single instance of Analysis Services, just like the SQL Server database engine, but you can configure a server to run more than one instance of the Analysis Services engine at the same time if necessary. With Analysis Services 2005, you can have on-demand, real-enough-time, or real-time updating of the analysis database. The notification of new data being available can be automatic if you are using SQL Server or via polling for other databases. You choose how long to wait before processing new data, and how old the data is allowed to be, and Analysis Services will ensure that if the data is not available in its database within that timeframe, it will revert to the relational data store until it is available. This feature is called proactive caching and is an important feature not just for real-time scenarios but for high availability, too. Updating performed using proactive caching does not mean taking the database offline. Development EnvironmentIn a BI development environment, you need to specify what the data sources are, what your dimensions and measures are, the goals of your KPIs, and other design criteria. This is not an end-user task, but a task for a BI developer. BI Development Studio is the graphical development environment where you create your Analysis Services database design, as shown in Figure 2-8. This is the same environment used to develop Integration Services packages and Reporting Services reports. Analysis Services projects can be included in source control services, and you can define multiple project targets, such as "dev," "test," and "production" environments. Figure 2-8. Cube designer in BI Development Studio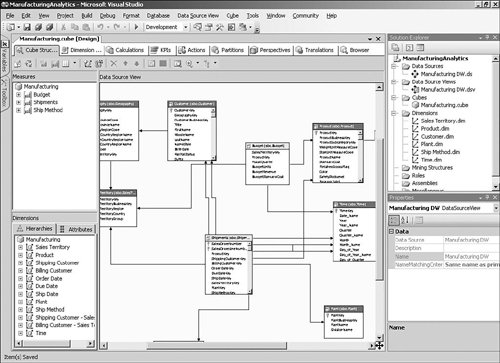 Building a basic cube is extremely simply, thanks to a wizard. All you need to do is to tell the wizard which tables to include, and it will determine which tables represent dimensions and which represent facts. If you have enough data in the tables, the wizard can determine some of the natural hierarchies of each dimension. You can be well on your way to having the framework for a cube within minutes. Many other wizards are available to help you build special objects such as time dimensions. In the designer, you also specify any KPI, actions, data partitioning, and other options you require. The result of building an Analysis Services project is an XML file that completely describes your design. You can have this file deployed to any server running Analysis Services, which creates the Analysis Services database and performs the initial population of the dimensions and cubes. You can use the Analysis Services Deployment Wizard to deploy your database to other servers and environments, and as part of the deployment, specify properties to change so that the solution will work in the new environment, such as the data source server, the log files, and so on. You can also reverse engineer an existing Analysis Services database into a BI Development Studio project. This is important because you can make changes to a live database through the SQL Management Studio, or through programmatic means; neither method modifies the underlying project. Managing and Securing Analysis ServicesYou use SQL Server Management Studio as shown in Figure 2-9 to perform routine maintenance, manage security, and to browse the dimensions and cubes. Figure 2-9. Management Studio with Analysis Services If you need to understand the kinds of queries being presented to a cube, you can use SQL Profiler (the same one used to trace relational queries). You can filter on the duration of a query, who issued the query, and many other attributes. You can capture the query string, put it into an Analysis Services query window in Management Studio, and execute it to review its results and test modifications to the query. Analysis Services by default requires authentication of connections using Windows authentication. When you log in to Windows, you are authenticated, and the credentials you receive are used by Analysis Services to determine your permissions. In this default mode, access to a database is not possible without an authenticated connection and explicit permission granted for that database. In Analysis Services, you create roles to which you give permissions to all or portions of a cube. You can place Windows groups or individual user accounts in these roles. Using groups makes administration easier because you no longer need to administer individual users, just a smaller number of groups, and the specific groups rarely change. You can configure Analysis Services to use Basic or Digest authentication or to simply grant unauthorized users access (although, of course, the latter is not generally recommended). The Unified Dimensional ModelOLAP technology can usually support all the different design elements covered in Chapter 1, "Introduction to Business Intelligence," including the ability to easily handle stars or snowflakes and to define hierarchies from the attributes in a dimension. However, in the past there has always been one major reason that people continued to use relational reporting as well as OLAP. Most OLAP technologies restrict users to drilling down through summary data along predefined hierarchies; so when users get to a point in their analysis where they want to see detailed transactional information, they need to switch to a relational report. SQL Server 2005 includes some OLAP innovations that can unify these previously separate relational and dimensional reporting models, called the Unified Dimension Model (UDM). The term UDM refers to the extended set of capabilities offered by Analysis Services 2005, which essentially means that cubes are not restricted to providing classic drilldown access through a star or snowflake schema, but can support detail-level reporting from complex real-world source databases. The major difference is that users of Analysis Services 2005 cubes are not restricted to a predefined set of hierarchies for querying the cube. Instead, they can use any descriptive attribute on a dimension to analyze information. This means that in addition to the classic OLAP-style reports with summary information, users can include attributes such as order numbers to generate reports with the most detailed level of information available, such as a list of order-line items. Support for Large and Mission-Critical BI SolutionsAs BI solutions become a key part of the strategy of a company, BI will quickly move from being simply an important initiative to a mission-critical system. In large and more complex BI solutions, Analysis Services' support for availability, scalability, and very large volumes of data become essential. AvailabilityAnalysis Services is cluster-aware. It can be placed in a failover cluster to provide fault tolerance or in a load-balanced cluster to provide more resources to support additional users or more complex queries. Database synchronization provides a means to propagate changes from an Analysis Services database to other databases in a load-balanced cluster. The cubes remain online during synchronization and present a consistent view to the users. When synchronization is complete, the new version of the database is presented to the users. ScalabilityAnalysis Services can be run on either 32-bit or 64-bit Windows platforms and can use as many processors as the operating system will support. Typically, you would use 2-way to 16-way servers, but you can go up to 128 processors. This extreme is usually unnecessary because Analysis Services databases can also be deployed to as many servers as required to support the volume of queries you have. Databases can be transparently synchronized from a master database to the other servers to support this scenario. Support for Very Large DatabasesWhen cubes become large, they could require a long time to process after the addition of new data. Analysis Services supports partitioning of cubes, and you only have to process partitions where the underlying data has changed. You usually partition over time, so by designing your partitions so that only the most recent ones are updated, you can reduce the overall processing time significantly (often to just a few minutes). |
EAN: 2147483647
Pages: 132