Debugging 101: Using Debugging Mode
Debugging 101: Using Debugging Mode
One way to identify a logic error is to execute your program code one line at a time and examine the content of one or more variables or properties as they change. To do this, you can enter debugging mode (or break mode) while your program is running and then view your code in the Code Editor. Debugging mode gives you a close-up look at your program while the Visual Basic compiler is executing it. It's kind of like pulling up a chair behind the pilot and copilot and watching them fly the airplane. But in this case, you can touch the controls.
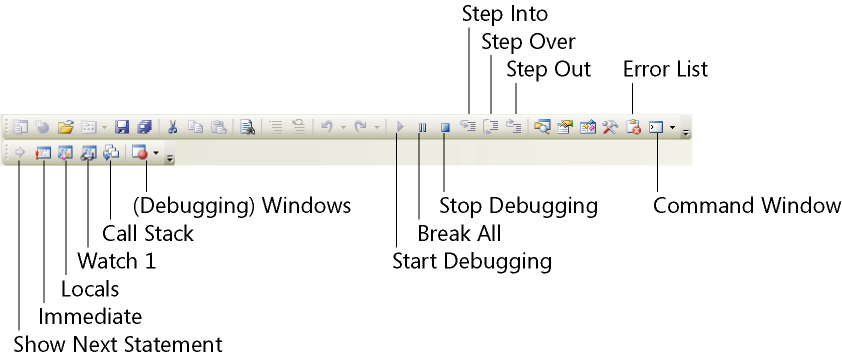
While you're debugging your application, you'll use buttons on the Standard toolbar and the Debug toolbar, as well as commands on the Debug menu and special buttons and windows in the IDE. The following illustration shows the debugging buttons on the Standard and Debug toolbars, which you can open by pointing to the Toolbars command on the View menu and then clicking Standard or Debug.
In the following exercise, you'll set a breakpoint—a place in a program where execution stops. You'll then use debugging mode to find and correct the logic error you discovered earlier in the If…Then structure. (The error is part of an actual program.) To isolate the problem, you'll use the Step Into button on the Standard toolbar to execute program instructions one at a time, and you'll use the Autos window to examine the value of key program variables and properties. Pay close attention to this debugging strategy. You can use it to correct many types of glitches in your own programs.
Debug the Debug Test program
Start Visual Studio.
On the File menu, click Open Project.
The Open Project dialog box appears.
Open the Debug Test project in the c:\vb05sbs\chap08\debug test folder.
The project opens in the development environment.
If the form isn't visible, display it now.
The Debug Test program prompts the user for his or her age. When the user clicks the Test button, the program informs the user whether he or she is a teenager. The program still has the problem with 13-year-olds that we identified earlier in the chapter, however. You'll open the Debug toolbar now, and set a breakpoint to find the problem.
If the Debug toolbar isn't visible, click the View menu, point to the Toolbars, and then click Debug.
The Debug toolbar appears below the Standard toolbar.
Click the Start Debugging button on the Standard toolbar.
The program runs and displays the Debug Test form.
Remove the 0 from the Age text box, type 14, and then click the Test button.
The program displays the message “You're a teenager.” So far, the program displays the correct result.
Type 13 in the Age text box, and then click the Test button.
The program displays the message “You're not a teenager,” as shown below.
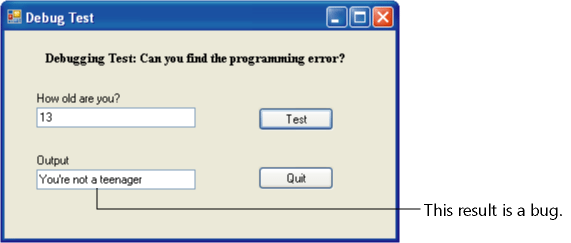
This answer is incorrect, and you need to look at the program code to fix the problem.
Click the Quit button on the form, and then open the Code Editor.
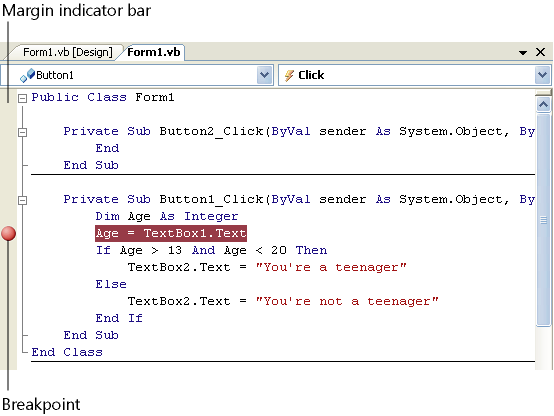
Move the mouse pointer to the Margin Indicator bar (the gray bar just beyond the left margin of the Code Editor window), next to the statement Age = TextBox1.Text in the Button1_Click event procedure, and then click the bar to set a breakpoint.
The breakpoint immediately appears in red. See the following illustration for the breakpoint's location and shape:
Click the Start Debugging button to run the program again.
The form appears just like before, and you can continue your tests.
Type 13 in the Age text box, and then click Test.
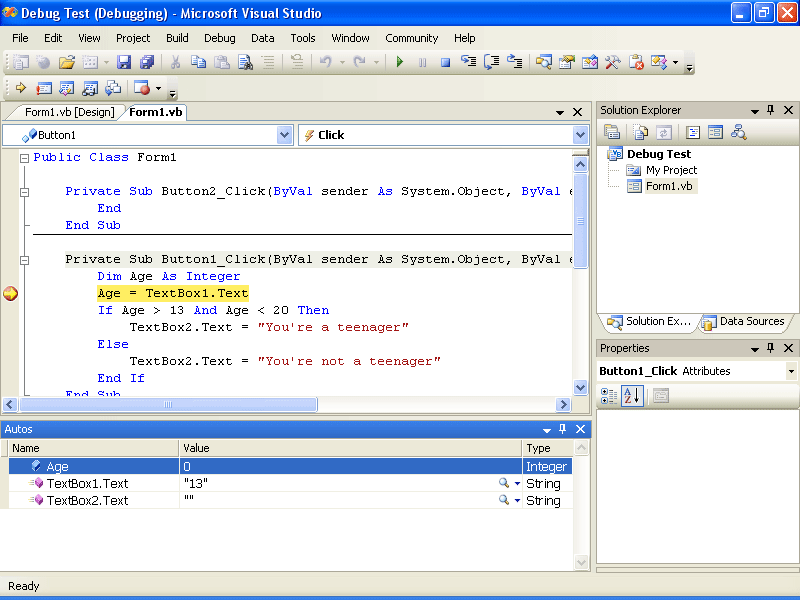
Visual Basic opens the Code Editor again and displays the Button1_Click event procedure—the program code currently being executed by the compiler. The statement that you selected as a breakpoint is highlighted in yellow, and an arrow appears in the Margin Indicator bar, as shown in the following illustration:
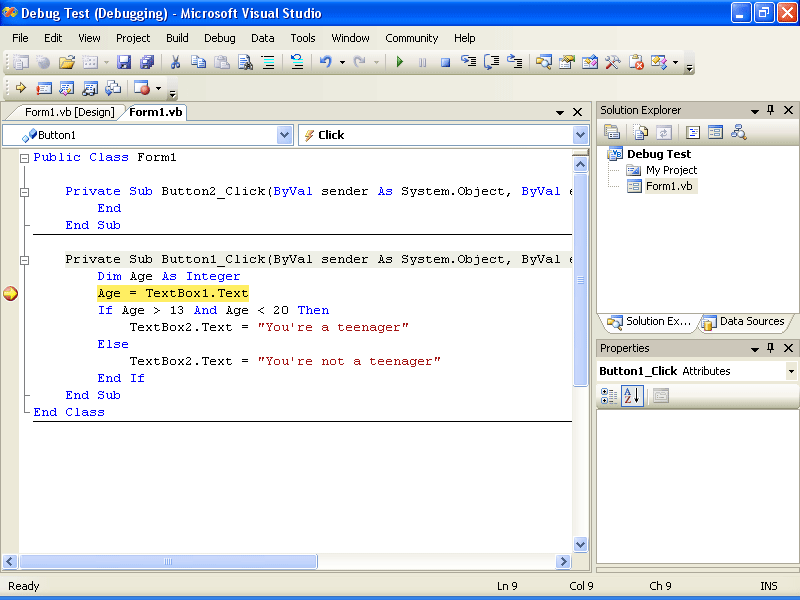
You can tell that Visual Studio is now in debugging mode because the word “Debugging” appears in its title bar. In debugging mode you have an opportunity to see how the logic in your program is evaluated.
NOTE
You can also enter debugging mode in a Visual Basic program by placing the Stop statement in your program code where you'd like to pause execution. This is an older, but still reliable, method for entering debugging mode in a Visual Basic program.Place the pointer over the Age variable in the Code Editor.
Visual Studio displays the message “Age = 0.” While you're in debugging mode, you can display the value of variables or properties by simply holding the mouse pointer over the value in the program code. Age currently holds a value of 0 because it hasn't yet been filled by the TextBox1 text box—that statement is the next statement the compiler will evaluate.
Click the Step Into button on the Debug toolbar to execute the next program statement.
The Step Into button executes the next program statement in the event procedure (the line that's currently highlighted). By clicking the Step Into button, you can see how the program state changes when just one more program statement is evaluated. If you hold the pointer over the Age variable now, you'll see that it contains a value of 13.
On the Debug menu, point to Windows, and then click Autos.
The Windows submenu provides access to the entire set of debugging windows in Visual Studio. The Autos window shows the state of variables and properties currently being used. As you can see in the following illustration, the Age variable holds a value of 13, the TextBox1.Text property holds a string of “13”, and the TextBox2.Text property currently holds an empty string (“”).
Click the Step Into button twice more.
The If statement evaluates the conditional expression to False, and the compiler moves to the Else statement in the decision structure. Here's our bug—the decision structure logic is incorrect because a 13-year-old is a teenager.
Select the conditional test Age > 13, and then hold the pointer over the selected text.
Visual Studio evaluates the condition and displays the message “Age > 13 = False.”
Select the conditional test Age < 20, and then hold the pointer over the selected text.
Visual Studio displays the message “Age < 20 = True.” The pointer has given us an additional clue—only the first conditional test is producing an incorrect result! Because a 13-year-old is a teenager, Visual Basic should evaluate the test to True, but the Age > 13 condition returns a False value. And this forces the Else clause in the decision structure to be executed. Do you recognize the problem? The first comparison needs the >= operator to specifically test for this boundary case of 13. You'll stop debugging now so that you can fix this logic error.
Click the Stop Debugging button on the Standard toolbar.
In the Code Editor, add the = operator to the first condition in the If statement so that it reads
If Age >= 13 And Age < 20 Then
Run the program again and test your solution, paying particular attention to the numbers 12, 13, 19, and 20—the boundary, or “fringe,” cases that are likely to cause problems.
Use the Step In button to watch the program flow around the crucial If statement, and use the Autos window to track the value of your variables as you complete the tests. When the form appears, enter a new value and try the test again. In addition, you might find that selecting certain expressions, such as the conditional tests, and holding the pointer over them gives you a better understanding of how they're being evaluated.
When you're finished experimenting with debugging mode, click the Stop Debugging button on the Standard toolbar to end the program.
Congratulations! You've successfully used debugging mode to find and correct a logic error in a program.
EAN: N/A
Pages: 168